2021: Volume 3, Issue 1
Past Issues
 Abstract
  PDF
PDFInfluence of Fe Addition on the Microstructure and Mechanical Properties of Cu Alloys
Huihui Yu*,1, Yanqi Zeng1, Rui Hong**,2
1Institute of Applied Physics, Jiangxi Academy of Sciences, Nanchang 330096, China
2School of Materials Science and Engineering, Chongqing University, Chongqing 400044, China
Corresponding authors: *Huihui Yu, Institute of Applied Physics, Jiangxi Academy of Sciences, Nanchang 330096, China. E-mail: [email protected]; **Rui Hong, School of Materials Science and Engineering, Chongqing University, Chongqing 400044, China. E-mail: [email protected]
Received: September 26, 2021
Published: October 27, 2021
ABSTRACT: The influence of Fe addition on the microstructure and mechanical properties of Cu alloys was studied. Combined with phase identification via EDS, X-ray diffraction shows that only Cu matrix and a-Fe phase exist in Cu-5Fe, Cu-10Fe and Cu-14Fe alloys. With the addition of Fe, the grain size refines from 1011 mm in pure Cu to around 46 mm in Cu-Fe alloys. Phase identification of the alloys via EBSD shows that the a-Fe phase with an average grain size of about 4 mm is located in grain boundaries and in the grain interior. With increasing Fe content, the yield stress largely increased while maintaining the high elongation to failure. The results show that grain refinement; second phase strengthening and texture strengthening effect play a descending-order role in the overall strengthening effect.
KEYWORDS: Cu-Fe alloy; grain refinement; texture; mechanical properties
INTRODUCTION
Pure Cu strip and rod have high electrical and thermal conductivity, being widely used as electric wire and electric connector and others. However, pure Cu has a low strength, with an ultimate strength lower than 400 MPa even in the rolled state. Thus, many alloy elements have been added to increase the strength of pure Cu, such as Ag [1, 2], Ni+Sn [3], etc. For example, a tensile strength of 870 MPa and an electrical conductivity of 78% IACS are achieved in an annealed nanostructure Cu-5Ag alloy, which is strengthened with nanotwins and nanoscale precipitates.
In recent years, Cu-Fe alloys, incorporating both the characteristics of high electrical conductivity and thermal conductivity of Cu and soft magnetic properties, high strength and rigidity of Fe [4, 5], have intrigued increasing interest in the field of magnetic conductive and electromagnetic shielding industry. Y. Li [6] studied the mechanical properties of Cu-10Fe alloy added with Ag and found that when the amount of Ag was 3 wt%, the conductivity of Cu-10Fe alloy increased by 1-4 % IACS after aging, and the tensile strength increased by 66-230 MPa. In addition, it is found that the addition of only 2 wt% Si on the Cu-10Fe alloy can lead to the microstructural evolution such as the microstructural refinement and the formation of secondary separated phases with the yield strength enhanced from 180 MPa to 285 MPa [4]. During the solidification of Cu-Fe alloy, the liquid phase separation happens The liquid phase separation is a kind of uneven distribution of Fe phase, which would result in severe macrosegregation, and will deteriorate the overall performance of Cu-Fe alloys. The higher the Fe volume fraction, the more sever the macrosegregation. Then, the composition, microstructure and properties of the Cu-Fe alloy are not uniform. Therefore, Cu-Fe alloy with a relatively uniform composition and uniform structure (especially alloys with an Fe content of more than 5 wt%) is hard to be prepared by the traditional casting method [11]. This is the case in China that Cu-Fe rolled strips can be successfully produced when Fe content is less than 5%. How different amounts of Fe addition (more than 5% Fe) influence the microstructure and properties of Cu-Fe alloys remains unclear. This work places great emphasis on the influence of Fe addition on the microstructure and mechanical properties in Cu alloys. The results find that the higher fraction of Fe addition, the harder the alloys. The relevant mechanism is discussed.
EXPERIMENTS AND METHODS
Sample preparation and mechanical tests
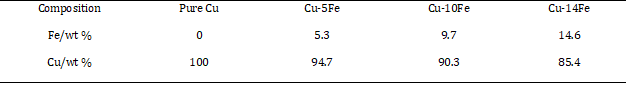
The as-cast Cu-xFe alloy (x=0, 5, 10 and 14 wt%) were fabricated by melting pure copper (99.99%) and iron (99.9%) using vacuum induction furnace (ZG-0.025) under Ar atmosphere. Pure Cu is purchased from Jiangxi Copper Group Co., LTD, and pure Fe from Nanchang Iron & Steel Co. LTD. The samples were cast into a plate-shape graphite mold of 45 mm thickness. Table 1 shows the compositions of different cast alloys. Tension tests along the long direction of the plate (denoted as RD) at room temperature were performed on a CMT5205 machine using a strain rate of 2 ×10⁻³ s-1. The specimens for tension tests were dog-bone shaped with a gauge length of 50 mm and across-section of 8×0.2 mm. At least three samples were tested for each condition.
Table 1: Compositions of the different cast alloys.
Phase identification of the alloys was performed using X-ray diffraction (XRD, Shimadzu XRD-7000). Electron backscatter diffraction (EBSD) mapping was conducted on a scanning electron microscope (SEM, EVO18) equipped with a HKL-EBSD system using a step size of 0.5 μm combined with energy dispersive X-ray spectrometry (EDS, X-Max20). The resulting inverse pole figure map, crystallographic orientation analysis, and pole figures were processed using commercial TSL OIM or Channel 5 software.Microstructure and texture measurements
RESULTS
Microstructure and texture
Fig. 1 shows the XRD patterns of as-cast Cu-xFe alloys (x=0, 5, 10 and 14). It can be seen that only the diffraction peaks of the Cu phase and a-Fe phase appear in the pattern for Cu-5Fe, Cu-10Fe and Cu-14Fe alloy. Obviously, increasing Fe content has no influences on the crystalline structures of Cu-Fe alloy. Fig. 2 displays the SEM image of as-cast alloys. It could be seen that for pure Cu, the grain size is quite large. For the Cu-Fe alloys in Fig. 2b-d, the grains are largely refined. EDS, performed both within the matrix and second phase, not shown here, confirmed the presence of a-Fe phase in Cu-5Fe, Cu-10Fe and Cu-14Fe alloy. It is found that the a-Fe phase with an irregular shape formed both in grain boundaries and grain interior.
.png)
Fig. 1: XRD patterns of as-cast Cu-xFe alloys (x=0, 5, 10 and 14).
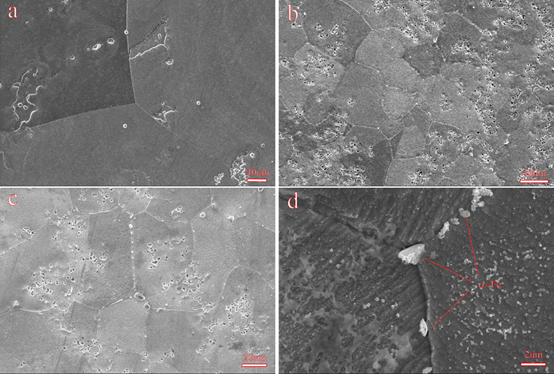
Fig. 2: SEM images of as-cast (a) pure Cu, (b) Cu-5Fe, (c) Cu-10Fe and (d) Cu-14Fe.
Inverse pole figure map and pole figures of as-cast pure Cu is shown in Fig. 3, with the measured texture component for Cu matrix and for a-Fe phase shown in table 2. The grain is quite large with an average grain size around 1011 mm. The dominant texture component is cube texture component and other components are weak. Fig. 4-6 give the inverse pole figure maps and pole figures of Cu matrix and a-Fe phase in as-cast Cu-5Fe, Cu-10Fe and Cu-14Fe respectively. In accordance with Fig. 2, the grains of Cu-5Fe, Cu-10Fe and Cu-14Fe are largely refined (46, 48 and 43 mm, respectively, measured by EBSD). The a-Fe phase with an average grain size about 4 mm locates both in grain boundaries and grain interior. The measured texture components for Cu matrix and a-Fe phase in table 2 show that for all alloys in the cast condition, the texture is random.
Table 2: Measured texture components for Cu matrix and for a-Fe phase.
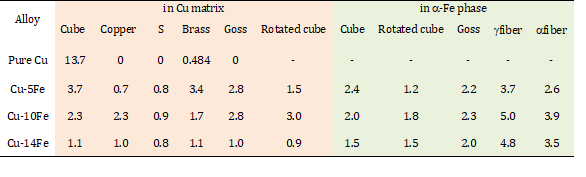
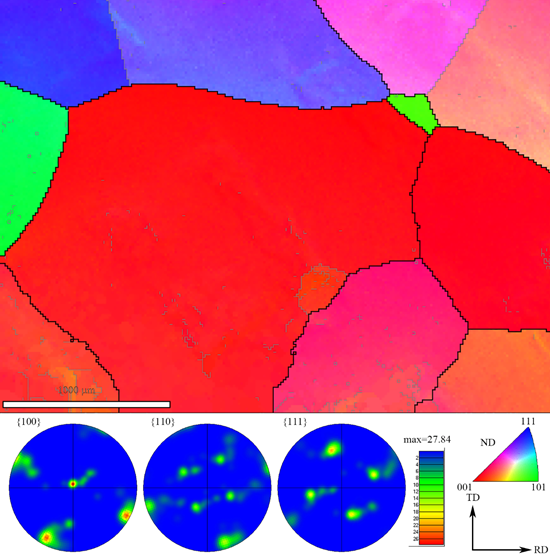
Fig. 3: Inverse pole figure map and pole figures of as-cast pure Cu. RD: long direction, TD: transverse direction.
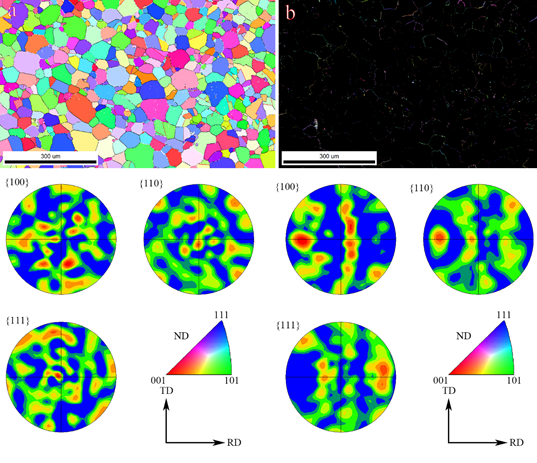
Fig. 4: Inverse pole figure maps and pole figures of (a) Cu matrix and (b) a-Fe phase in as-cast Cu-5Fe. RD: long direction, TD: transverse direction.
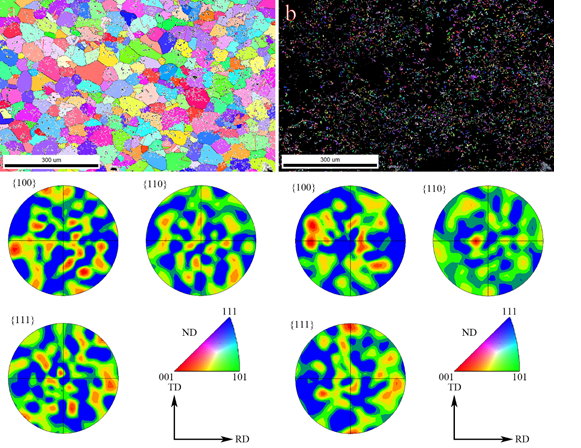
Fig. 5: Inverse pole figure maps and pole figures of (a) Cu matrix and (b) a-Fe phase in as-cast Cu-10Fe. RD: long direction, TD: transverse direction.
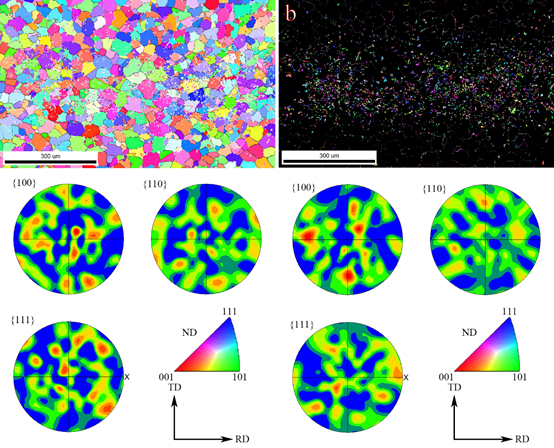
Fig. 6: Inverse pole figure maps and pole figures of (a) Cu matrix and (b) a-Fe phase in as-cast Cu-14Fe. RD: long direction, TD: transverse direction.
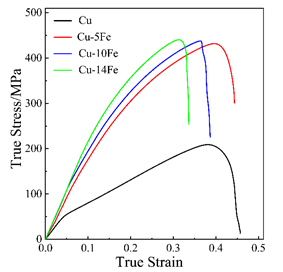
Fig. 7: True tensile stress-stain curves of as-cast Cu-xFe alloys (x=0,5,10 and 14) under tension along the RD at room temperature, RD: long direction.
Mechanical behavior
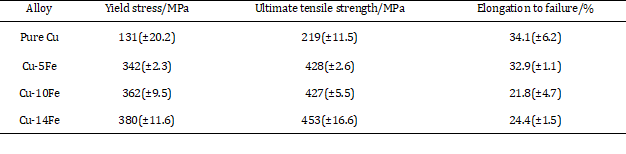
The true stress-strain curves under tension are displayed in Fig. 7 with the relevant mechanical properties listed in Table 3. It is found that with increasing Fe addition, the yield stress and ultimate tension strength are increased while maintaining a high value of elongation to failure. It should be noted that the yield stress improvement between pure Cu and Cu-5Fe is as high as 211 MPa, whilst the yield stress increment between different Cu-Fe alloys is low.
Table 3: Mechanical properties under tension along RD for different cast alloys.
The mechanical properties of alloys are partially governed by grain size. A reduction in grain size serves to enhance yield stress as formulated by the well known Hall-Petch relationship [12, 13].DISCUSSION
σy=σo+ kd-1/2 (1)
where σy is the yield stress, σo is the friction stress when dislocations glide on the slip plane, d is the average grain size, and k is the stress concentration factor. The relationship provides guidance for a straightforward way to produce stronger and harder materials. Grain boundaries impede dislocation slip and smaller grains limit dislocation pile-up sizes which affects how easily dislocations can traverse grain boundaries and propagate from grain to its neighboring grain. A higher applied stress is then necessary to propagate dislocations between neighboring grains and this effectively increases the yield stress and hardness [14]. In the present work, for pure Cu in the cast state, the grain size is as large as 1011 mm. With the addition of 5%Fe, the grain is largely refined to 46 mm. Grain refinement strengthening should be one of the main strengthening factors. On the opposite, with more Fe addition, the average grain size hardly changes and the yield stress increase is relatively small. Therefore, grain refinement should be an important strengthening factor.
Second phase strengthening should be another important strengthening factor. For Cu-5Fe alloy, a large number of fine a-Fe phase is induced. Those a-Fe phases largely located in grain boundary and in the grain interior as shown in Fig. 8. The fine and dispersed a-Fe phases would largely hinder dislocations slip and then strengthen the alloy. The case is almost the same as Cu-10Fe and Cu-14Fe. The volume fraction of a-Fe phase is much higher in Cu-10Fe and Cu-14Fe than that in Cu-5Fe, the yield stress is therefore higher as shown in Fig. 7 and table 3.
Texture could also be a strengthening factor, which is referred as the texture strengthening effect. Schmid factors (SFs) as a function of the relative spatial position in EBSD maps and relevant distribution for slip under tension along the RD for the four alloys are depicted in Fig. 9, with the relevant average SF listed in Table 4. It is shown that for the pure Cu, the SF is as low as 0.1972, while for other alloys, the SF is reduced but the value of average SF is similar for Cu-5Fe, Cu-10Fe and Cu-14Fe. The lower the SF, the higher the texture strengthening effect. The SF in a-Fe phase is also calculated as shown in Table 4. The SF in a-Fe phase is slightly higher than that in Cu matrix, but the value of average SF in a-Fe phase is similar for Cu-5Fe, Cu-10Fe and Cu-14Fe. The hardness of a-Fe phase is much higher than that of Cu matrix [15], the Cu matrix would undergo plastic deformation ahead of the a-Fe phase during the yielding stage. It is therefore the SF in Cu matrix that turns out to be a more important factor for the texture strengthening effect.
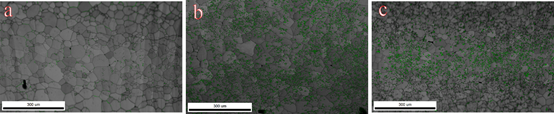
Fig. 8: Phase distribution map of as-cast (a) Cu-5Fe, (b) Cu-10Fe and (c) Cu-14Fe alloy. a-Fe phase is colored in green.
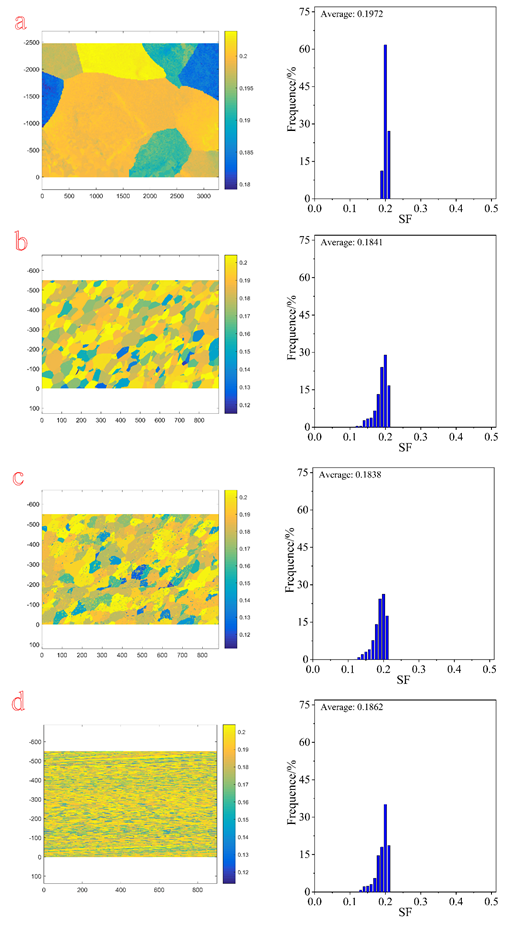
Fig. 9: Schmid factors (SFs) as a function of the spatial position in EBSD maps and corresponding distribution for slip under tension along the RD of (a) pure Cu, (b) Cu-5Fe, (c) Cu-10Fe and (d) Cu-14Fe. RD: long direction.
All in all, grain refinement and second phase should be two important parameters in strengthening effect. However, the grain refinement should be the more efficient factor, since the volume fraction of a-Fe phase is highest in Cu-14Fe, but the yield stress between Cu-5Fe, Cu-10Fe and Cu-14Fe is similar. The texture strengthening effect should also play a minor role in the strengthening effect.
CONCLUSIONS
The current study reports the influence of Fe addition in the microstructure and mechanical properties of Cu alloy. Only Cu matrix and a-Fe phase exist in Cu-5Fe, Cu-10Fe and Cu-14Fe alloy. With the addition of Fe, the grain refines from 1011 mm in pure Cu to around 46 mm. The a-Fe phase with an average grain size about 4 mm is located in grain boundaries and in the grain interior. With addition of Fe, the yield stress is largely increased with the maintenance of high elongation to failure. The results show that grain refinement, second phase strengthening and texture strengthening effect play a descending-order role in the strengthening effect. The results in this work could provide guidance in texture evolution and properties evaluation in Cu alloys.
DATA AVAILABILITY
All relevant data supporting the findings of this study are contained in the paper and its supplementary information files. All other relevant data are available from the corresponding authors on request.
ACKNOWLEDGEMENTS
This study was co-supported by the Doctoral program of Jiangxi Academy of Sciences Research and Development Special Fund (2020-YYB-13); Key R & D project of Jiangxi Province (20202BBEL53022); Key research and development project of Jiangxi Academy of Sciences(2020-YZD-07)and Jiangxi Academy of Sciences major scientific research and development project (2020-YZD-2).
REFERENCES
1. Wu X, Wang R, Peng C, Zeng J. (2020). Ultrafine grained Cu–3Ag-xZr (x = 0.5, 1.0 wt%) alloys with high strength and good ductility fabricated through rapid solidification and cryorolling. Materials Science and Engineering: A. 778: 139095. 2. Zhang BB, Tao NR, Lu K. (2017). A high strength and high electrical conductivity bulk Cu-Ag alloy strengthened with nanotwins. Scripta Materialia. 129:39-43. 3. Jeon WS, Shur CC, Kim JG, Han SZ, Kim YS. (2008). Effect of Cr on the corrosion resistance of Cu–6Ni–4Sn alloys. Journal of Alloys and Compounds. 455(1-2):358-363. 4. Jo HR, Kim JT, Hong SH, Kim YS, Park HJ, Park WJ, Jin MP, Kim KB. (2017). Effect of silicon on microstructure and mechanical properties of Cu-Fe alloys. Journal of Alloys and Compounds. 707:184-188. 5. Sarkar S, Srivastava C, Chattopadhyay K. (2018). Development of a new class of high strength copper alloy using immiscibility route in Cu-Fe-Si system: Evolution of hierarchical multi-scale microstructure. Materials Science and Engineering: A. 723:38-47. 6. Li Y, Yi D, Zhang J. (2015). Comparative study of the influence of Ag on the microstructure and mechanical properties of Cu-10Fe in situ composites. Journal of Alloys and Compounds. 647:413-418. 7. Wang M, Zhang R, Xiao Z, Gong S, Jiang Y, Li Z. (2020). Microstructure and properties of Cu-10 wt%Fe alloy produced by double melt mixed casting and multi-stage thermomechanical treatment. Journal of Alloys and Compounds. 820:153323. 8. Liu S, Jie J, Guo Z, Yue S, Li T. (2019). A comprehensive investigation on microstructure and magnetic properties of immiscible Cu-Fe alloys with variation of Fe content. Materials Chemistry and Physics. 238:121909. 9. Liu SC, Jie JC, Zhang JJ, Wang PF, Wang TM, Li TJ, Yin GM. (2018). A surface energy driven dissolution model for immiscible Cu-Fe alloy. Journal of Molecular Liquids. S0167732218312881. 10. Yuan D, Zeng H, Xiao X, Wang H, Han B, Liu B, Yang B. (2021). Effect of Mg addition on Fe phase morphology, distribution and aging kinetics of Cu-6.5Fe alloy. Materials Science and Engineering: A. 812:141064. 11. Wang M, Jiang Y, Li Z, Xiao Z, Gong S, Qiu W, Lei Q. (2021). Microstructure evolution and deformation behaviour of Cu-10 wt%Fe alloy during cold rolling. Materials Science and Engineering: A. 801:140379. 12. Hall EO. (1951). THE DEFORMATION AND AGEING OF MILD STEEL: III DISCUSSION OF RESULTS. Proceedings of the Physical Society of London Section B. 64(381):747-753. 13. Petch NJ. (1953). The Cleavage Strength of Polycrystals. J. Iron Steel Inst. 174:25-28. 14. Hall EO. (1954). Variation of Hardness of Metals with Grain Size. Nature. 173(4411):948-949. 15. Moon J, Park JM, Bae JW, Do H-S, Lee B-J, Kim HS. (2020). A new strategy for designing immiscible medium-entropy alloys with excellent tensile properties. Acta Materialia. 193:71-82.
Copyright: Yu H, et al. © (2021). This is an open-access article distributed under the terms of the Creative Commons Attribution License, which permits unrestricted use, distribution, and reproduction in any medium, provided the original author and source are credited. Citation: Yu H, et al. (2021). Influence of Fe Addition on the Microstructure and Mechanical Properties of Cu Alloys. Material Sci. 3(1):10.