2020: Volume 2, Issue 1
Past Issues
 Abstract
  PDF
PDFMicrostructures at 1250°C of Chromia–Forming Carbides– Reinforced Nickel–based Alloys after Addition of Tantalum; Effects of the Cr and Co Contents
Patrice Berthod
Université de Lorraine, CNRS, IJL, F-54000 Nancy, France
Corresponding author: Patrice Berthod, Université de Lorraine, CNRS, IJL, F-54000 Nancy, France, E-mail: [email protected] Received: September 07, 2020 Published: October 12, 2020
ABSTRACT
Cast nickel–based alloys can access to good mechanical properties at elevated temperatures even in total absence of gamma prime precipitates. Versions in which TaC carbides are present in significant quantities have recently emerged at laboratory scale but further optimization is required prior to possible industrial use. The main remaining problem is an insufficient stability of the TaC phase due to competition with chromium. This latter element is an essential element for the hot corrosion resistance and it cannot be removed. However, a better rating in Cr and a limited introduction of cobalt, element known to be more favorable for TaC stability, may lead to TaC–reinforced nickel–based superalloys. In this work thermal tests and thermodynamic calculations contributed to a better knowledge of the effect of added cobalt onthe nature of the carbides population in chromium–rich alloys based on nickel. On the one hand three alloys with different amounts in added cobalt were synthesized and exposed to 1250°C isothermally on long time. On the other hand thermodynamic calculations were carried out using a database especially designed for this used but not yet perfect. Adding Co to a {Ni, 25 wt.%Cr}–base containing carbon and tantalum obviously allows favoring predominant TaC at the expense of chromium carbides. The TaC fraction was accurately determined for each Co addition and verified by image analysis. Thermodynamical calculations showed the same trends but with a different origin: chromium carbides exist alone in the alloy when Co starts to be added while TaC are already present in the real alloy in absence of cobalt. Improvements need to be brought to the used database to better predictions and to take benefit of it to explore the possible high temperature microstructures when the contents in Co, Ta, Cr and C vary over more extended intervals than tested in this work.
KEYWORDS: Cast nickel alloys; Tantalum; Elevated temperature microstructures; Thermodynamic calculations
INTRODUCTION
In the wide family of nickel–based superalloys for uses at very high temperatures (1000°C and even more) the most known ones are currently the g/g’single crystalline ones (advanced foundry: directional solidification using grain selector) and the austenitic ODS superalloys (ODS for “Oxide Dispersion Strengthened”, powder metallurgy with mechanical alloying and abnormal grain growth). The mechanical strength at elevated temperature of these modern superalloys is of high levels and they resist creep over long times even when several hundreds of MPa are applied [1]. At the same times these superalloys are exposed to hot oxidation. Aluminum, element already present as gamma prime precipitates (g’, Ni3Al for the chemically simplest ones), allows them efficiently resisting this first chemical aggression [2,3]. However, when deposits may constitute on the surfaces of hot components – such as molten sulfates or CMAS – the presence of several tens of weight percent chromium is often considered as compulsory in the superalloys which are not isolated from gases and condensed liquids by a thermal barrier or a coating [4,5]. 25 – 30 wt.%Cr is the typical weight chromium content which is recognized as efficient for protection against hot corrosion by melts, as well as against oxidation by hot air or combustion gases. Unfortunately aluminum and chromium cannot be present in a same nickel–based alloy with content values simultaneously high enough to allow both efficient corrosion resistance and good g’–strengthen. When the key factor for lifetime is corrosion by melts the chromium content must be rated at a high level, which unfortunately forbids any g’–induced reinforcement. Solid solution hardening or carbides–strengthening are other metallurgical ways for achieving mechanical resistance at high temperature at an acceptable level.
Among the elements which are able to act on the two previous ways for strengthen superalloys at high temperature there is tantalum. As a heavy element (about 181 g/mol) its presence in solid solution induces distortion of the austenitic crystalline network of a nickel–base while, as MC–carbide former element it may promote the interdendritic development of a Chinese–script skeleton of TaC carbides resulting in good interdendrite binding. Contrarily to what happens in other metallurgical systems (Co–Cr [6], Fe–Cr [7]), Ta does not behave as a priority carbides–former when chromium is also present in high quantity. For instance the Ni–30Cr–0.2C–3Ta, Ni–30Cr–0.4C–3Ta and Ni–30Cr–0.4C–6Ta quaternary alloys studied in an earlier work [8] contained a mix of tantalum carbides and of chromium carbides in the as–cast state, despite the atomic equivalence between tantalum and carbon in two out of three alloys. After isothermal stage of several hours at three different levels of high temperatures (ranging from 1000 to 1200°C) tantalum carbides have decreased in surface fraction to the benefit of chromium carbides, and even totally disappeared. In the later cases tantalum had integrally reintegrated the matrix for the benefit of solid solution strengthening but at the expense of the interdendrite cohesion which is also a key point for the mechanical resistance at high temperature. Indeed, after the first hours of exposure at high temperature carbides tend changing in term of morphology, faster for chromium carbides than for tantalum carbides. For long service durations it is important to keep tantalum carbides with volume fractions high enough to allow their slow–changing script–like morphology favoring good cohesion at intergrain and interdendritic boundaries a long time.
Two ways may allow limiting the partial disappearance of TaC carbides due to competition between tantalum and chromium: choosing a lower chromium content for the alloys (but still compatible with a chromium–forming behavior for good oxidation and corrosion resistance) and adding a new element to partly substitute to nickel in the matrix for favoring TaC at the expense of chromium carbides. For the first point a 5 wt.%Cr–decrease may have significant effect without risk for the chromia–forming behavior: so 25 wt.%Cr was chosen for the alloys of this study. Above, cobalt and iron were cited as base elements of alloys in which TaC predominate even in presence of high Cr contents. Fe being much more deleterious than cobalt for the oxidation resistance this is cobalt which was chosen here. Furthermore cobalt and tantalum are associated in a couple of commercial superalloys, such as the Mar–M 322 and Mar–M 509 cast cobalt–based commercial superalloy in which TaC carbides play an important role in the high temperature mechanical resistance. Co and Ta were otherwise the subject of several thermodynamic studies (e.g. concerning binary [9–11] and ternary [12,13] systems), the results of which can be included in databases useful for anticipating stable microstructures at elevated temperatures. A first alloy derived from the Ni–30Cr–0.4C–6Ta alloy earlier studied [8], containing 25 wt.%Cr against 30wt.%,was considered. Two other alloys, consisting of the later alloy with two levels of Ni–by–Co substitution, were added to the study. These three alloys were elaborated and exposed at an elevated temperature – 1250°C – for a rather long time – 70 hours – to observe with which carbides network configuration they finish to stabilize. Beside these experiments thermodynamic calculations will be also carried out to complete the study.
MATERIALS AND METHODS
Synthesis of the Three Alloys
The base alloy (Ni–30Cr–0.4C–6Ta) – called “NNN” alloy – and its two Co–enriched versions {13.7 wt.%Co at the expense of Ni; Cr, C and Ta: unchanged contents; called “NNc” alloy} and {27.4 wt.%Co at the expense of Ni; Cr, C and Ta: unchanged contents; called “Ncc” alloy}, were synthesized by high frequency induction melting (CELES furnace, France) under 300mbars of pure Argon. From pure elements (Ni balls, Co flakes, Cr parts, Ta parts and graphite rod, bought from Alfa Aesar, purity of each > 99.9%), three ingots were obtained. Each of them weighed about 40 grams and was of a compact shape.
Exposure to High Temperature
Samples were machined in these ingots, using a rotating cutter equipped with an abrasive wheel (Delta Abrasimet from BUELHER, United States, for coarse machining) and a metallographic saw (Delta Isomet 5000 from BUELHER, United States, for fine machining). They were ground with SiC papers (#1200 grade, STRUERS, Denmark) on all their flat faces and edges and corners were smoothed to avoid possible catastrophic oxidation which may lead – due to the particularly severe conditions of temperature and duration – to total destruction of the samples, or at least to possible significant change in chemical composition for the bulk. Each sample ready to be exposed at elevated temperature was introduced in the “hot zone” of the resistive furnace of a thermobalance (TGA92 from SETARAM, France). Here it was heated at 20°C min-1 up to 1250°C. After {70 hours}–long isothermal exposure at this temperature it was cooled at -5°C min-1, down to ambient temperature.
Chemical and Microstructure Characterization
The obtained samples were embedded in an araldite resin (CY230) added with a strengthener (HY956) both from ESCIL (France). After total hardening of the embedding product, the samples were extracted out of the mold and were cut in two parts, which allowed revealing the internal alloy preserved from any chemical change possibly induced by external oxidation. Metallographic samples (embedded again and conventionally polished until obtaining a mirror–like state) were prepared for the control of the chemical composition and for the microstructures observations. This characterization was carried out using a JSM6010LA scanning electron microscope (SEM) from JEOL (Japan) equipped with an Energy Dispersion Spectrometer (EDS). The used acceleration voltage was 20kV.Imaging of the aged microstructure of the internal alloy was performed using the back scattered electrons detector (BSE), at magnifications ranging from × 250 to × 1000. EDS was used another time for performing spot analyses aiming to know the chemical composition of the matrix of each {1250°C, 70h–aged alloy. Five spot analyses were thus carried out in the core of the dendrites, far from the interdendritic carbides. In each case this led to an average value and a standard deviation value.
Calculation of the TaC Fractions
Despite that alloys were not double–phased but triple–phased, chromium carbides were integrated into matrix for further calculations. That is, the volume mass in chromium carbides (rather low) was neglected by comparison with the matrix one, and the Ta content in the whole {matrix + chromium carbides} domain was supposed to be very close to the Ta content in the sole matrix. This allowed carrying out calculations as if the chromium carbides did not existed. These calculations were done according to the following equations:
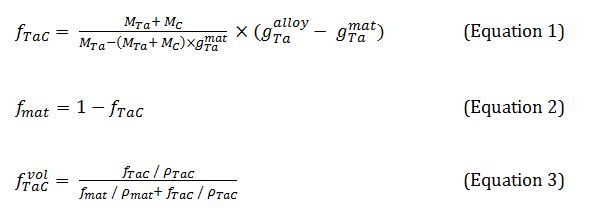
In which: g_Ta^alloy is the weight fraction of tantalum in the alloy (6 wt.%), g_Ta^matis the weight fraction of tantalum in the matrix (given by EDS measurements) M_Tais the molar mass of tantalum (180.95 g mol-1), M_Cis the molar mass of carbon (12.01 g mol-1) f_TaC is the mass fraction of the TaC carbides, f_mat is the mass fraction of the matrix f_TaC^vol is the volume fraction of the TaC carbides ρmat is the volume mass of the matrix (taken equal to 9 g cm-3), ρ_carb is the volume mass of the carbide (14,3 g cm-3) Thus, from the Ta weight contents in the matrix, one will deduce the mass fractions of TaC (eq. 1) and the one of matrix (eq. 2; in fact: matrix + chromium carbides). The TaC volume fractions will result from eq. 3.
Thermodynamic Calculations
A thermodynamic approach was also carried out in parallel. For that, one used the N version of the Thermo–Calc (from Foundation for Computational Thermodynamics, Sweden), working with the SSOL database to which the descriptions of supplementary systems were added:Ni–Ta [14], Co–Ta [9], Cr–Ta [15], Cr–Ni–Ta [16], Ni–Ta–C [17] and Ta–Co–C [18].
RESULTS & DISCUSSION
Chemical Compositions of the Three Alloys as Shown by EDS
By looking to table 1 on can see that the targeted Co and Cr contents were globally obtained. The Ta content seems higher than wished: this is only due to its concentration in TaC carbides emerging on surface. Ta can be considered as well respected too. For carbon, EDS is not an efficient mean to measure its contents, notably in alloys in which very low contents, as 0.4 wt.%, are expected.

Table 1: Chemical compositions of the obtained alloys (average ± standard deviation from five full frame × 1000 EDS analyses).
Microstructures of the Studied Alloys: As–Cast State
The microstructures of the three alloys, as they were obtained when removed from the CELES furnace, presented in figure 1, are obviously composed of three different phases: a dendritic matrix, dark particles and bright particles. EDS is not efficient on wide areas of polished alloys, but the same technique can be accurate enough for analyzing carbon–rich particles with focalized electrons beam. Spot analyses allowed identifying the dark particles as being Cr7C3 carbides and the bright ones as being TaC carbides. Furthermore, knowing that all these particles are carbides, the fractions of the observed carbide let think that carbon was also well respected since the presence density of carbides are typical of such C content. Two principal remarks can be done concerning carbides, one concerning their location and one concerning their morphologies. Carbides, dark or bright, are all located in the interdendritic areas: this reveals that they probably precipitated at the end of solidification. The shapes of the carbides, acicular (dark carbides) or script–like (bright carbides), make that they are closely imbricated with matrix, more precisely the external part of the dendrites. These carbides are surely eutectic carbides (Cr7C3 + matrix eutectic and TaC + matrix eutectic). One can remark that the TaC carbides seems more present in the “Ncc” alloy than in the “NNc” one, and in the “NNc” one than in the “NNN” one. At the same time, the evolution of the Cr7C3 presence is inverse.
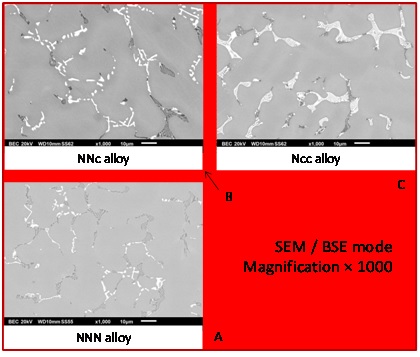
Figure 1: As–cast microstructures of the three alloys.
Microstructures of the Studied Alloys: Aged State
After 70 hours spent at 1250°C the microstructures of the three alloys are changed (Figure 2): the acicular shape of the Cr7C3 is lost and these carbides are now blocky and coarser. The loss of global continuity also affects the TaC carbides. Concerning the surface fractions of the carbides of the two types, they evolve in different ways when cobalt is more and more present in the alloy (“NNN” → “NNc” → “Ncc”): as for the as–cast microstructures, the TaC fraction increases at the expense of the Cr7C3 fraction which decreases.
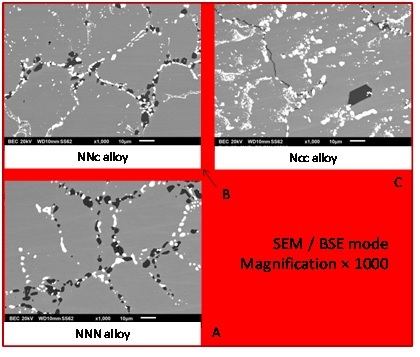
Figure 2: Microstructures of the three alloys aged at 1250°C.
Interpretation of the As–Cast and Aged Microstructures using Thermodynamic Calculations
The isopleth section at 25 wt.%Cr–0.4wt.%C–6 wt.%Ta of the {Ni–Co–Cr–C–Ta} with pressure fixed 100,000 Pa and with Temperature as variable condition on the Y–axis was calculated using Thermo–Calc and the Ta–enriched SSOL database. It is presented in figure 3. According to this diagram solidification has started by the nucleation and growth of the Face Centered Cubic Ni–base solid solution. Due to the probable constitution under cooling, matrix developed taking a dendritic shape. The second solid phase to precipitate should be the M7C3chromium carbides (alloys “NNN” and “NNc”). Eutectic carbides on two types were expected only for the “Ncc” alloy. During the solid–state cooling first TaC may precipitate in the “NNc” alloy and, at lower temperature, the M7C3 carbides are expected to transform in M23C6 carbides, as in the “Ncc” alloy. This is (at least) a little different from what is observed in the as–cast alloys, notably for the “NNN” alloy. This may be explained by too fast solidification and solid–state cooling which cannot allow alloys to respect the successive thermodynamic equilibria concerned by the decreasing temperature.
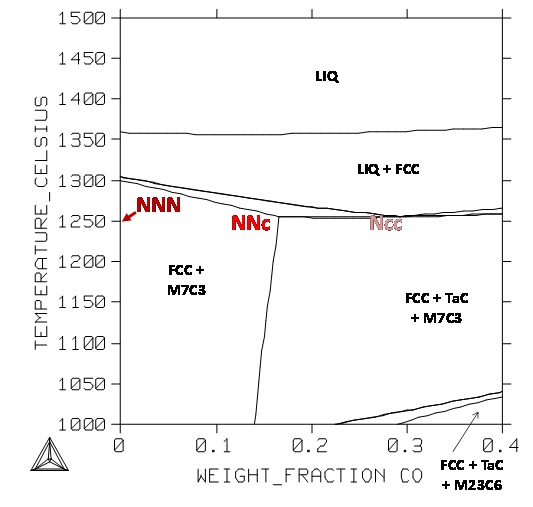
Figure 3: Isopleth section of the quinary system for the Cr, C and Ta contents fixed at 25, 0.4 and 6wt.% respectively; positions of the NNN, NNc and Ncc alloys.
During the isothermal 1250°C–stage the microstructures which will surely stabilize during the 70 hours of exposure. Here too, qualitatively, there are mismatches between experiments and calculations (Figure 3, Figure 4): tantalum carbides are present in the three alloys while TaC should be absent in the “NNN” and “NNc” alloys. Here, no–equilibrium conditions cannot be pointed out.
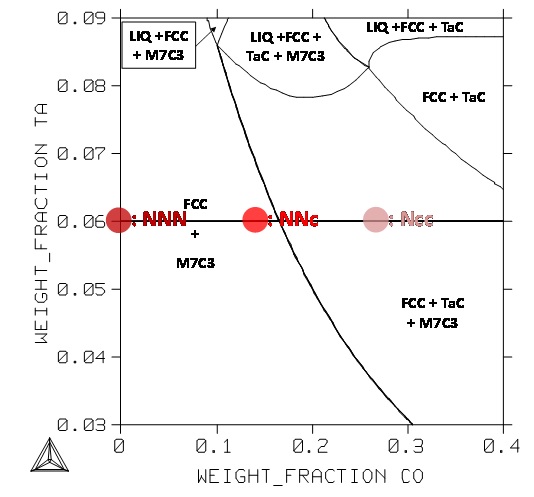
Figure 4: Section at 1250°C of the quinary system for the Cr and C contents fixed at 25 and 0.4wt.% respectively; positions of the NNN, NNc and Ncc alloys.
Chemical Composition of the Matrix; Comparison with Thermodynamic Calculations
Five EDS spot analyses were carried out per alloy in the core of the dendrites. In parallel the calculated metallurgical states are also characterized by specific chemical compositions for the matrix. Average and standard deviation experimental values of the contents in Co, Cr and Ta in the matrix and the corresponding calculated values are displayed in table 2. Very good agreement exists between the experimental and calculated Co contents. In contrast, this is not really the case for the Cr content: the experimental Cr content is systematically a little higher than the calculated ones. This can be explained by the fact that calculations say that chromium carbides are the only carbide phase to be present in the “NNN” and “NNc” alloys while metallography clearly showed that significant quantities of tantalum carbides are also present and thus, carbon was not totally available for chromium carbides. The impoverishment of the matrix in chromium is thus lower in reality than in theory and the Cr content in matrix consequently higher in real alloys than predicted by calculations. This is logically the inverse phenomenon for tantalum: more TaC in real alloys than predicted, therefore less tantalum in the matrix than according to calculations.
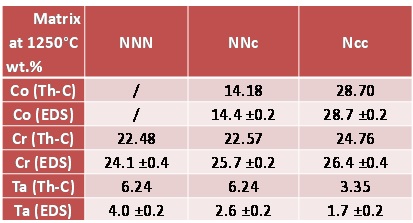
Table 2: Comparison of the calculated and EDS–measured chemical compositions of the matrixes of the 1250°C–aged alloys (EDS: average ± standard deviation from five full frame ×250 analyses).
Deduction of the Quantities of TaC Carbides from the Ta Contents in Matrix
The experimental values of the Ta contents in matrix allowed, according to the three equations presented above, specifying the mass fractions of tantalum carbides in the 1250°C–aged alloys. The results are presented in table 3. In the first results line there are the mass fractions (bottom, between parentheses) and the corresponding volume fractions (top). Logically the results are zero for the “NNN” and “NNc” alloys, while 3 mass.% i.e. 1.9 vol.% of TaC are predicted at the 1250°C–equilibrium by Thermo–Calc in the Co–richest “Ncc” alloy. The last line contains three types of results: the central ones, in bold characters, correspond to the average value of the matrix Ta content measured by EDS. Just above the values correspond to average + 1 standard deviation and just below, the values correspond to average – 1 standard deviation. Mismatches necessarily exist between theoretic and experimental values for the “NNN” and “NNc” alloys in which TaC are present as demonstrated by observations although calculations said that only chromium carbides should be present. There is also a quantitative disagreement between experimental and calculations for the third alloy, “Ncc” for which both ways showed that TaC are present: the predicted TaC quantity is lower than really observed in the aged alloy.
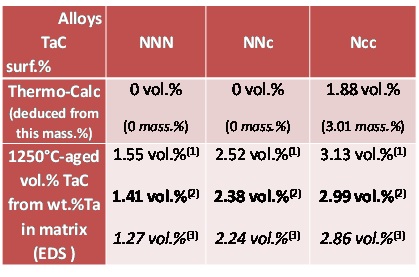
Table 3: Comparison of the volume fractions of TaC deduced from the mass fractions calculated by Thermo–Calc, with the TaC volume fractions deduced from the mass fractions deduced from the EDS–measured Ta contents in the matrixes of the 1250°C–aged alloys. (1: average Ta in matrix - s, 2: average Ta in matrix, 3: average Ta in matrix + s; s = standard deviation).
Qualitative Comparison with the Surface Fractions as Seen on BSE Micrographs
In parallel with the preceding determination of volume fractions of TaC carbides, the surface fractions of TaC were directly measured on SEM/BSE micrographs using the image analysis tool present in the Photoshop CS software of Adobe to verify if the obtained volume fractions are realistic. This tool allows, after grey level threshold rating, transforming in white (respectively black) pixels all pixels with a grey level higher (resp. lower) than the threshold value. It allows thereafter counting the white (resp. black) pixels before dividing their number by the total number of pixels of the image. The obtained surface fractions tended to be more or less higher than the volume fractions contained in the last line of table 3. Thus it was preferred, inversely, to look for the gray level rating allowing finding the values of surface fractions equal to the volume fractions, and thereafter to verify if the adopted threshold leads to gray–free black & white pictures remained similar to the initial pictures. The obtained results are illustrated in figure 5 for the “NNN” alloy, in figure 6 for the “NNc” alloy and in figure 7 for the “Ncc” alloy: globally the correspondence is rather good.
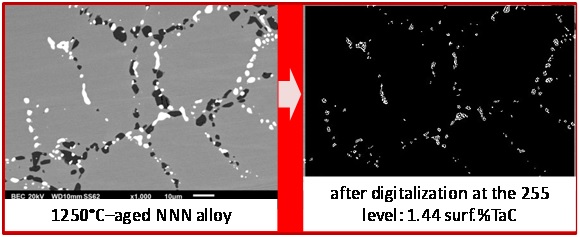
Figure 5: Threshold rating for retrieving the TaC surface fraction in the “NNN” alloy deduced from the EDS–measured Ta content in matrix.
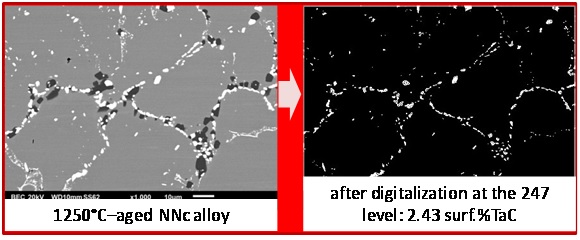
Figure 6: Threshold rating for retrieving the TaC surface fraction in the NNc alloy deduced from the EDS–measured Ta content in matrix.
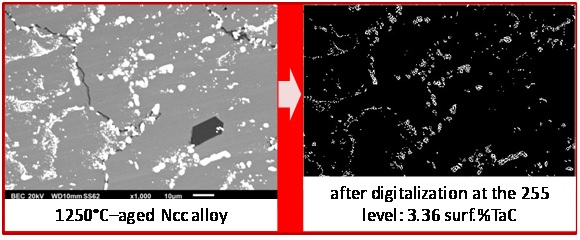
Figure 7: Threshold rating for retrieving the TaC surface fraction in the Ncc alloy deduced from the EDS–measured Ta content in matrix.
Potential Interest of Thermodynamic Calculations
Despite the lack of agreement between the calculation results and the experimental observations – certainly due to the used database in which some important Ta–containing systems are still missing – thermodynamic modeling is of great potential interest. Here, despite the not complete description of several systems involving tantalum, interesting predictions were possible. This may concern the progress of the solidification of alloys. For instance calculations shown that the matrix is the first phase to crystallize, followed by the carbides. Such information allows anticipating both localization and morphologies of the different solid phases. Some illustrative examples of 1250°C–isothermal calculated maps are given in figure 8, figure 9 and figure 10.
In the first case (Figure 8) the contents in Cr and in C are fixed at the same values as for the three alloys of the study, the Co content varies from 0 to 40 wt.% (i.e. farer than for the three alloys) and the Ta content varies from 0 up to 10 wt.%. This allows seeing that, at 1250°C, the carbide network may be made of only chromium carbides (M7C3, namely Cr7C3) if the Ta and/or Co contents are too low. If they are present in higher quantities TaC can be present and co-exist with the chromium carbides. For Co and Ta contents simultaneously high, it is possible to have TaC as the single carbide present, for 35wt.%Co and 9wt.%Ta for example. But one can also see that high Ta and Co contents may lead to partial fusion at this temperature.
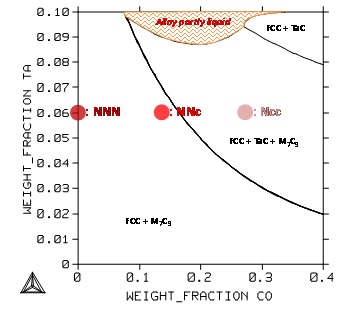
Figure 8: Section at 1250°C of the quinary system for the Cr and C contents fixed at 25 and 0.4wt.% respectively; positions of the NNN, NNc and Ncc alloys.
In the second case (Figure 9) there is the Co content and the Cr content which varies for fixed contents in Ta and in C. Obviously the chromium content must be carefully rated. Indeed, in addition to the predictable decrease in hot oxidation and corrosion resistance, too low content in Cr risk to expose the alloy to possible melts start when arriving close to 1250°C during heating. The same danger may appear when chromium is present in the alloy with too high amount.
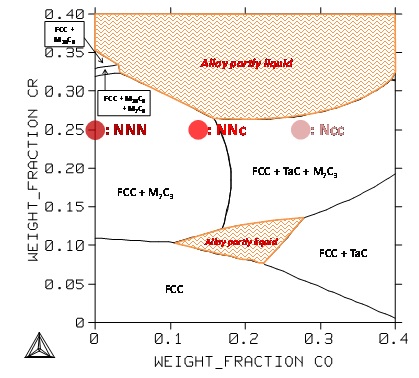
Figure 9: Section at 1250°C of the quinary system for the Ta and C contents fixed at 6 and 0.4wt.% respectively; positions of the NNN, NNc and Ncc alloys.
In the third case (Figure 10) the Co and C contents both vary for fixed values of the Ta and Cr contents. The carbon content is to be rated at a sufficient value, not only to allow developing a carbide network dense enough for mechanically reinforcing the alloy for applications at 1250°C, but also to allow the alloy being far from a mushy {solid + liquid} state detrimental for the mechanical properties. This last isothermal section also shows, as the first one (Figure 8), that it is not really possible to have only TaC carbides at 1250°C without being close to this mushy zone.In the third case (Figure 10) the Co and C contents both vary for fixed values of the Ta and Cr contents. The carbon content is to be rated at a sufficient value, not only to allow developing a carbide network dense enough for mechanically reinforcing the alloy for applications at 1250°C, but also to allow the alloy being far from a mushy {solid + liquid} state detrimental for the mechanical properties. This last isothermal section also shows, as the first one (Figure 8), that it is not really possible to have only TaC carbides at 1250°C without being close to this mushy zone.
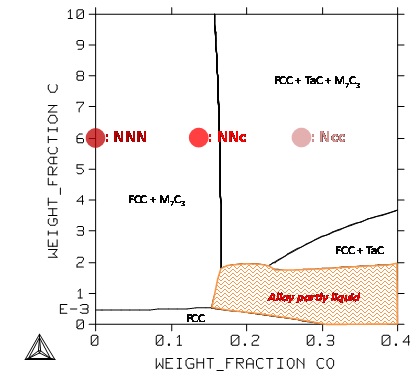
Figure 10: Section at 1250°C of the quinary system for the Cr and Ta contents fixed at 25 and 6wt.% respectively; positions of the NNN, NNc and Ncc alloys.
CONCLUSION
Cobalt is thus able to take over from the decrease in chromium content to achieve better rating between the proportions of tantalum carbides and chromium carbides. This was seen first on as–cast alloys despite their not equilibrium microstructures but more seriously with the alloys aged at 1250°C. Clearly, adding Co to such chromium–rich nickel–based alloys moves the TaC/Cr7C3 ratio toward higher values. Thanks to the difference in Ta content between alloy and matrix the mass fraction of TaC carbides, and after conversion, their volume fractions were successfully assessed, and globally validated by image analysis. Thermodynamic calculations showed the same trend but with an offset attributed to the not complete description of the Ni–Cr–Cr–C–Ta system in the used database. Despite this problem thermodynamic modeling demonstrated interesting potentialities and improving the database may lead to a useful tool for predicting solidification sequences and thermodynamically stable metallurgical states.
REFERENCES
- Donachie MJ, Donachie SJ. (2002). Superalloys: A Technical Guide [2nd Ed.], ASM International, Materials Park.
- Kofstad P. (1988). High Temperature Corrosion, Elsevier applied science, London.
- Young DJ. (2008). High Temperature Oxidation and Corrosion of Metals, Elsevier Corrosion Series, Amsterdam.
- Sims CT, Hagel WC. (1972). The Superalloys, John Wiley & Sons, New York.
- Bradley EF. (1988). Superalloys: A Technical Guide, ASM International, Metals Park.
- Berthod P, Michon S, Aranda L, Mathieu S, Gachon JC. (2003). Experimental and thermodynamic study of the microstructure evolution in cobalt-base superalloys at high temperature. Calphad. 27:353–359.
- Berthod P, Hamini Y, Aranda L, Héricher L. (2007). Experimental and thermodynamic study of tantalum-containing iron-based alloys reinforced by carbides: Part I —Case of (Fe, Cr)-based ferritic steels. Calphad 31: 351–360.
- Berthod P, Aranda L, Vébert C, Michon S. (2004). Experimental and thermodynamic study of the high temperature microstructure of tantalum containing nickel-based alloys. Calphad. 28:159–166.
- Liu Z, Chang YA. (1999). Thermodynamic assessment of the Co–Ta system. Calphad. 23:339–356.
- Shinagawa K, Chinen H, Omori T, Oikawa K, Ohnuma I, et al. (2014). Phase equilibria and thermodynamic calculation of the Co–Ta binary system. Intermetallics. 49: 87–97.
- Wang P, Kobmann J, Kattner UR, Palumbo M, Hammerschmidt T, Olson GB. (2019). Thermodynamic assessment of the Co-Ta system. Calphad. 64:205–212.
- Kumar KCH, Van-Rompaey T, Wollants P. (2002). Thermodynamic calculation of the phase diagram of the Co-Nb-Ta system. ZMetallkd. 93:1146–1153.
- Guo C, Wu T, Li C, Du Z. (2018). Thermodynamic re-assessment of the Re–X (X=Al, Co, Cr, Ta) binary systems. Calphad. 61: 33–40.
- Ansara I, Selleby M. (1994). Thermodynamic analysis of the Ni–Ta system. Calphad. 18:99–107.
- Dupin N, Ansara I. (1993). Thermodynamic assessment of the Cr–Ta system. J Phase Equilib. 14:451–456.
- Dupin N, Ansara I. (1996). Thermodynamic assessment of the Cr–Ni–Ta system. Z. Metallkd. 87:555–561.
- Yuwen C, Zhanpeng J. (1999). Thermodynamic assessment of the Ni–Ta–C ternary system. T Nonferr Metal Soc. 9:757–763.
- Dumitrescu L, Ekroth M, Jansson B. (2001). Thermodynamic assessment of the Me–Co–C systems (Me = Ti, Ta or Nb). Metall Mater Trans A. 32A:2167–2174.
Copyright: Berthod P. ©2020. This is an open-access article distributed under the terms of the Creative Commons Attribution License, which permits unrestricted use, distribution, and reproduction in any medium, provided the original author and source are credited.
Citation: Berthod P. (2020). Microstructures at 1250°C of Chromia–Forming Carbides–Reinforced Nickel–based Alloys after Addition of Tantalum; Effects of the Cr and Co Contents. Material Sci. 2(1): 06.